Power BI for MSP Operations: from a CMMC RPO partner since 2002
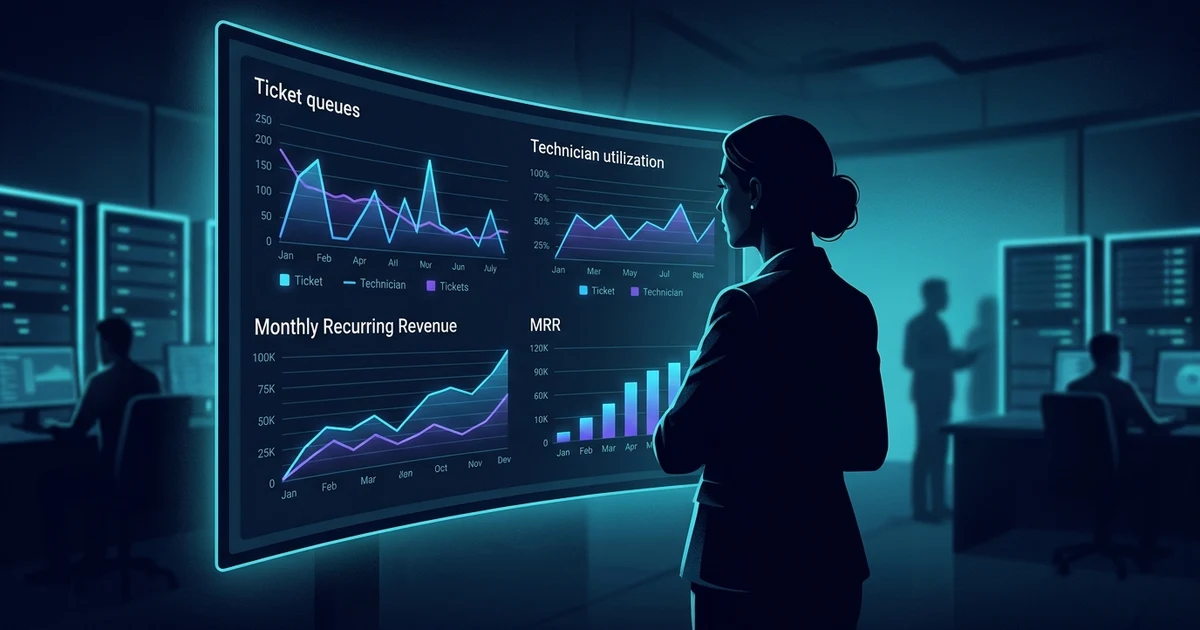
Power BI for MSP shops puts ticket SLA, technician utilization, MRR movement, churn risk, and security-ops posture on the same screen. Petronella Technology Group, Inc. builds the dashboards your dispatcher, vCIO, and owner actually open every morning, connected to ConnectWise PSA, Autotask, HaloPSA, Syncro, SuperOps, Atera, plus your RMM, accounting, and SIEM, in 4-6 weeks under a single fixed-fee engagement.
What Power BI dashboards do MSPs and MSSPs need?
Most managed service providers need a small portfolio, not a single giant report. The minimum viable set is five boards: a Service Coordinator daily triage (open tickets, SLA at risk, dispatcher load), a Tech Utilization dashboard (billable percentage, escalation rate, after-hours load), an MRR Movement dashboard (new, expansion, contraction, churn), a vCIO Quarterly Business Review pack for client meetings, and, for MSSPs, a daily security posture board tracking MTTD, MTTR, EDR coverage, vulnerability remediation SLA, and patch compliance. Petronella Technology Group, Inc. builds this portfolio on a single semantic model so a metric like utilization or SLA attainment is defined once and used everywhere.
The tribal-knowledge dispatcher problem
Walk into ten MSPs at 8:45am and you will see ten variations of the same scene. The service coordinator has nine browser tabs open. Tab one is the PSA queue. Tab two is RMM alerts. Tab three is a spreadsheet showing which clients are on which agreement so they know whether the after-hours ticket bills T&M or counts against the block. Tab four is Outlook, where two clients are escalating. Tab five is Teams, where the senior tech is pasting a status update. The dispatcher is, at this moment, the entire operational dashboard of the company, a person doing the job that a system should do.
That tribal-knowledge dispatcher works exactly as long as the dispatcher is there. When the dispatcher takes vacation, the desk feels it inside an hour. When the dispatcher quits, the desk feels it for six months. And the dispatcher has no way to roll up last month, only this moment, so the owner has no operating picture beyond a feeling.
Power BI for MSP firms fixes this by codifying what the dispatcher already knows. The triage view becomes a board with named columns, color-coded SLA risk, and a count of open tickets per technician. Tech utilization becomes a number, not a hunch. Client health stops being an end-of-month surprise and becomes a leading indicator the account manager can see Tuesday morning. The system is not replacing the dispatcher, it is replacing the spreadsheets and tabs that the dispatcher has been carrying for years.
The reason most MSPs have not done this is not technical. It is that the data lives in five different places: tickets in the PSA, billable hours in time tracking, agreement details in CPQ, RMM alerts in another portal, and accounting in QuickBooks or Xero. Building a unified dashboard means landing all of those into a single semantic model, conforming identifiers across them, and writing the right measures, which is precisely the engineering work that gets pushed off because there is always one more ticket. Power BI consulting from Petronella Technology Group, Inc. is the wedge that gets it done.
Ready to get started? Request a Quote →
The MSP / MSSP KPI library
You do not need fifty metrics. You need the right twenty, defined once and trusted everywhere. The KPI library below is what Petronella Technology Group, Inc. starts every MSP operations dashboard engagement from. Each metric is mapped to a specific dashboard, a specific data source, and a specific owner inside your business.
Operations: the service desk runs on these
Financial: what the owner needs Monday morning
Resource: people are the constraint
Security operations: the MSSP scorecard
Client health: the leading indicators
Data source integration: PSA, RMM, accounting, SIEM
The reason ConnectWise Power BI and Autotask Power BI searches keep climbing is that MSP owners have learned, the hard way, that the PSA vendor's native reporting only goes so far. Power BI is the layer where you escape vendor reporting limits, blend data, and unify after acquisitions. Below is the integration map Petronella Technology Group, Inc. uses on every MSSP reporting dashboard engagement.
PSA: ticket, time, agreement, billing
- ConnectWise PSA
- REST API + ConnectWise Manage Reporting Tables. Mature, well-documented, and the most common MSP PSA in North America.
- Autotask PSA
- Autotask REST API (the SOAP API is deprecated). Time entries, tickets, contracts, billing items.
- HaloPSA
- HaloPSA REST API. Strong for MSPs that moved off ConnectWise and Autotask in recent years.
- Syncro
- Syncro REST API. Common in the SMB MSP segment; integrates well into Power BI via dataflows.
- SuperOps
- SuperOps REST API. Newer entrant, AI-native architecture, growing among modern MSPs.
- Atera
- Atera REST API. PSA-plus-RMM combined; useful when MSP operates a single Atera tenant.
RMM: endpoints, alerts, asset inventory
- ConnectWise Automate
- SQL Server backend; can be reached via direct DB read-replica or via the ConnectWise Automate API.
- NinjaOne
- NinjaOne REST API. Growing rapidly in the MSP RMM market.
- Datto RMM
- Datto RMM API (Kaseya). Strong device + patch telemetry.
- Kaseya VSA
- VSA API. Both VSA 9 and VSA 10 supported via their respective API surfaces.
- N-able N-central
- N-central API. Strong for MSPs with significant Linux / network device counts.
Accounting: MRR truth, gross margin truth
- QuickBooks Online
- Intuit QBO API. Most common in the SMB-MSP segment.
- Xero
- Xero API. Common in MSPs serving accounting-firm clients.
- Sage Intacct
- Sage Intacct API. Often present in MSPs that have grown past $10M revenue.
- NetSuite
- NetSuite SuiteAnalytics / REST. Standard for MSPs that have crossed into the mid-market.
Security operations: the MSSP layer
- Microsoft Sentinel
- Native Power BI integration. The cleanest pattern for MSSPs that have standardized on Microsoft.
- Sophos Central
- Sophos Central API. Endpoint, MTR, MDR data into a single semantic model.
- Petronella XDR
- Telemetry export to Power BI. The platform Petronella Technology Group, Inc. operates for managed XDR clients, see managed security services.
- CrowdStrike Falcon
- Falcon API. Standard EDR coverage and detection feed for higher-tier MSSP stacks.
- ConnectWise SIEM
- ConnectWise SIEM (formerly Perch) API for MSSPs already in the ConnectWise stack.
Quoting / CPQ: pipeline and renewal
- QuoteWerks
- QuoteWerks REST API / direct DB read. Quote pipeline and renewal tracking.
- ConnectWise CPQ (Sell)
- Sell API for MSPs in the ConnectWise stack.
- ScalePad / Lifecycle Insights
- Asset-aging, warranty-expiry, and lifecycle data into Power BI.
The pattern is the same across all of these: read-only service accounts that you own, dedicated to the analytics use case, time-bound where appropriate, with the access documented in writing. We do not store your tenant credentials. We do not need a domain admin. We need read access to the systems we are blending, that is it.
Example dashboards we ship
These are the boards that, in our experience, get opened every day inside MSPs and MSSPs. We do not ship all of them in every engagement, we start with the three that match how your business runs, then layer in the rest as the semantic model proves itself.
vCIO Quarterly Business Review
Per-client deck assembled from the semantic model: tickets, SLA, satisfaction, lifecycle exposure, MRR by service line, action-items from the last QBR, and the next-quarter roadmap. The dashboard exports to PDF/PowerPoint with a single click for the client meeting.
Service Coordinator Daily Triage
The morning board. Open tickets by SLA status, owner, age, and client. Color-coded SLA-at-risk lane, a dispatcher-load panel, and a quick filter for after-hours and escalated tickets. Replaces the nine-tabs workflow.
NOC Daily Health
RMM alert volume, top noisy clients, patch compliance, backup success, monitoring agent coverage gaps, and unmanaged-asset surfacing. Aimed at the NOC tech and team lead.
Tech Utilization
Billable percentage per technician, with a defensible utilization formula documented inline. Sliced by tier, board, and client. Drilldown to the underlying time entries so you can resolve disputes in seconds.
MRR Movement
The financial truth board. New MRR, expansion MRR, contraction MRR, churned MRR, with the underlying contract changes that drove each movement. Account-manager and salesperson views available.
Churn Risk Watch
Clients flagged by composite signal: rising ticket trend, low CSAT, missed QBRs, falling MRR, leadership change, or AR aging. Account managers see their slice; ownership sees the whole book.
MSSP Daily Security Posture
Per-tenant MTTD, MTTR, EDR coverage, MFA enrollment, patch compliance, and high-severity open vulnerabilities. SOC analyst view plus executive summary view.
Owner Daily Health
The single board the owner opens with coffee. Cash, AR aging, billable, last week's MRR delta, churn risk count, escalations, and the one thing that is on fire. Designed for a 90-second read.
AI augmentation: what actually pays back
Power BI Copilot is real, useful, and limited, especially for MSPs and MSSPs whose end-clients include regulated verticals. Petronella Technology Group, Inc. layers AI on top of the dashboards in four places that produce measurable lift inside an MSP.
1. Ticket-trend classification
The PSA gives you the buckets it ships with. The real categories, user-training gap, shadow-IT incident, license confusion, security false positive, vendor outage, live in the ticket body. We run a private language model on Petronella fleet GPUs over ticket text to label them. Dispatchers and account managers then see patterns they could not see by eye.
2. QBR narrative auto-draft
The dashboard already has the numbers. We let Penny, the Petronella private-AI assistant, draft the first pass of each client's quarterly narrative directly from the KPIs, what changed, what we recommend, what to ask the client, so your vCIO edits a draft instead of starting blank. Saves 30-90 minutes per QBR.
3. Tech burnout anomaly detection
After-hours percentage, escalation rate, consecutive overtime weeks, and last PTO date. We surface a composite burnout signal so service delivery managers see the curve before the tech does. This pays back in retention.
4. Churn-risk scoring (advanced)
A composite model layered after the baseline dashboards are stable. We typically deploy this in month four or later, after you have enough labeled history (renewed vs churned) to train against. It is real value, just not a Day-1 lift.
For MSPs that serve CMMC, HIPAA, or legal-adjacent clients, Petronella Technology Group, Inc. runs the AI augmentation layer on private infrastructure, no third-party copilot, no commercial data exposure, no Microsoft tenant lock-in for AI features. Penny is the Petronella private-AI assistant. The semantic model and the dashboards stay in your Power BI tenant. Copilot for Power BI is also available where the data classification supports it.
Want this for your MSP: without re-building from scratch?
Most MSP owners reading this page already know what they want their dashboards to look like. The question is whether to build it in-house, with the engineer-hours, semantic-model decisions, and PSA-quirk archaeology that implies, or to bring in a partner who has already done the work and can ship it under your brand.
Petronella Technology Group, Inc. works with MSPs and MSSPs nationally as a Power BI delivery partner. If you are outside the Raleigh / Triangle market, we are not a geographic competitor to your managed-services book, we are an analytics partner that builds the dashboards your clients see while you keep the managed-services revenue, the QBR seat, and the relationship.
Engagements are co-branded or single-branded (your brand) depending on your preference. A written referral / channel agreement spells out the boundary, we do not pursue managed IT, managed security, or compliance work with your client outside the analytics scope. Your account stays your account.
For MSPs serving regulated verticals, DoD supply chain, defense manufacturing, healthcare, legal, we bring the Petronella engagement model: RPO #1449, four CMMC-RPs on staff, an A+ BBB-accredited 23-year operating history, and a licensed Digital Forensic Examiner (DFE 604180) leading the practice. Your client gets work that can stand in front of a CMMC assessor or a HIPAA auditor.
What the partnership covers
- Power BI semantic model build for your end client, PSA, RMM, accounting, security stack.
- Co-branded or your-branded dashboards. We can ghost-build entirely behind your logo.
- Written non-solicitation on managed services, MSSP, and compliance for the duration plus a tail.
- Penny private-AI deployed on your client's tenant if they want the AI layer.
- Optional ongoing managed reporting, we keep the model fresh; you keep the relationship.
If you operate inside the Raleigh / Triangle market, we can still talk. We can set written scope and exclusion zones so it is clear which clients are out-of-bounds for our managed-services arm. No-compete on your existing book is a default term, not a negotiated one.
Engagement model: the MSP Operations Pack
Petronella Technology Group, Inc. delivers Power BI for MSPs under a single named engagement, the MSP Operations Pack, with a fixed scope and a fixed timeline. Pricing is "Request a Quote" because the actual cost depends on the size of your integration surface (one PSA versus three after acquisitions, MSSP layer or not, multi-tenant rollup or single book).
Process: six steps from kickoff to live
Ready to scope this for your shop? Request a Quote →
Petronella Technology Group vs alternatives
| Option | Time to live | Multi-tool unification | MSSP layer | Regulated-vertical readiness | Channel-friendly |
|---|---|---|---|---|---|
| Petronella Technology Group, Inc. | 4-6 weeks | Yes, semantic model design is the core skill | Yes, CMMC RPO #1449, DFE on staff | Yes, CMMC, HIPAA, legal-adjacent | Yes, written referral agreement |
| PSA-vendor reporting (native) | Immediate | No, one PSA only | Partial, depends on vendor | Partial | N/A |
| Generic MSP analytics SaaS | Days | Limited, vendor connectors only | Limited | Limited, depends on tenant residency | N/A |
| Hire an internal BI analyst | 6-12 months ramp | Yes, once ramped | Possibly, security expertise hard to find | Depends entirely on the hire | No, it is your team |
| Upwork freelancer | Weeks (per project) | Limited | Limited | Limited, rarely audit-ready | No, ad-hoc |
| Big-4 / Tier-1 consulting | Months | Yes | Yes | Yes | No, conflict on managed-services |
Frequently asked questions
What Power BI dashboards do MSPs and MSSPs need?
Most MSPs need a small portfolio of operating dashboards rather than one giant report. The core set is a Service Coordinator daily triage view (open tickets, SLA at risk, dispatcher load), a Tech Utilization dashboard (billable percentage, time on category, escalation rate), an MRR Movement dashboard (new MRR, expansion, contraction, churn), a vCIO Quarterly Business Review pack for client meetings, and, for MSSPs, a daily security posture board with MTTD, MTTR, EDR or XDR coverage, and patch compliance. Petronella Technology Group, Inc. builds this portfolio on a single semantic model so a metric like utilization or SLA attainment is defined once and used everywhere.
Does Power BI connect to ConnectWise PSA or Autotask?
Yes. ConnectWise PSA exposes a REST API and ConnectWise also publishes Manage Reporting Tables that Power BI can connect to directly. Autotask exposes a REST API used by mature MSP analytics products. HaloPSA, Syncro, SuperOps, and Atera all expose REST APIs that Power BI can consume through a custom connector, an Azure Data Factory pipeline, or a thin middleware layer. The right pattern depends on data volume, refresh cadence, and whether the MSP is on a Fabric capacity. Petronella Technology Group, Inc. typically lands raw PSA tables in a small dataflow, transforms in Power Query or a warehouse, and serves a clean semantic model to the dashboards.
Can Power BI roll up a multi-tenant MSP across many clients?
Yes, and this is one of the highest-value patterns. With Row Level Security in Power BI, a multi-tenant MSP can give each client a slice of the same report while internal staff see the whole portfolio. Tech leads see only their pod, account managers see only their accounts, vCIOs see the full book. The semantic model carries the security predicate once. Petronella Technology Group, Inc. always treats Row Level Security as a Day-1 design decision, not a Day-90 retrofit.
How do you measure tech utilization without arguments?
Pick a single utilization formula and stand behind it in writing. The most defensible MSP formula is billable hours divided by available hours, where available hours equals scheduled hours minus PTO, training, internal projects, and approved admin time. Then publish that definition next to the chart. The arguments stop once everyone is reading from the same definition. Petronella Technology Group, Inc. builds a small data dictionary alongside every dashboard so the definition lives next to the number.
Can Power BI show real-time tickets or do I need a different tool?
Power BI supports near-real-time for most MSP use cases via Import refresh on a tight schedule, DirectQuery against the warehouse, or DirectLake on Microsoft Fabric. For a service coordinator board that needs sub-minute freshness, push the open-ticket queue into a streaming dataset and overlay it. For SLA reporting, hourly Import is usually enough. Most MSP service desks do not need sub-minute updates, they need the right snapshots at the right cadences.
We use multiple RMM and PSA tools after acquisitions, can Power BI unify them?
Yes. This is a very common pattern for MSPs that have grown by acquisition. The clean approach is to land each source system in its own staging area, define a unified ticket model and a unified asset model, and conform identifiers like client, site, and tech across systems. Power BI then reads the unified model rather than each underlying source. Petronella Technology Group, Inc. has integrated stacks combining ConnectWise PSA with ConnectWise Automate, NinjaOne with Autotask, Datto RMM with HaloPSA, and other mixes, the pattern is the same: unify in the middle, present once.
How does AI fit into MSP operations dashboards?
Three places that pay back fastest. First, ticket-trend classification: a private language model labels incoming tickets into categories that the PSA does not natively track (for example user training, security false positive, license issue), which surfaces patterns dispatchers cannot see by eye. Second, quarterly business review narrative: a private model drafts the first pass of each client QBR narrative from the raw KPIs so the vCIO edits a draft rather than starts blank. Third, anomaly detection on burnout signals such as after-hours percentage, escalation rate, and consecutive overtime weeks per tech. Churn-risk scoring is also possible but it is a more advanced model, we usually deploy it after the baseline dashboards are stable.
What about the security side, what should an MSSP measure?
The core MSSP scorecard tracks Mean Time to Detect, Mean Time to Respond, endpoint detection and response coverage (active agent percentage versus expected), vulnerability remediation against SLA windows, patch compliance by Patch Tuesday cycle, phishing-test pass rate, and MFA enrollment percentage. Power BI can pull these from Microsoft Sentinel, Sophos Central, CrowdStrike, ConnectWise SIEM, and the Petronella Extended Detection and Response (XDR) platform. A weekly executive board and a daily analyst board are both worth building.
We're a small MSP, is Power BI worth it under twenty techs?
Yes, and arguably the value is higher per dollar at small headcounts because every hour of dispatcher overhead is a larger share of capacity. A small MSP gets the fastest payback from a Service Coordinator daily board plus an MRR Movement and Churn Risk dashboard. You do not need Fabric capacity or Premium-per-User to start. A well-designed Pro tenant with a clean semantic model can carry a twenty-tech shop comfortably. Petronella Technology Group, Inc. sizes the engagement so the licensing matches the operational reality, not the marketing brochure.
Can Petronella Technology Group, Inc. build Power BI dashboards for our MSP clients without competing with us?
Yes. Petronella Technology Group, Inc. works with MSPs nationally outside the Raleigh region as a delivery partner, we build Power BI dashboards for your end clients under your brand or under co-branding, with a written referral agreement that we will not pursue managed IT, managed security, or compliance work with your client outside the analytics scope. Your account stays your account. We are a CMMC Registered Provider Organization (RPO #1449) with four CMMC Registered Practitioners and a 23-year operating history, so we can stand behind regulated-vertical work that requires audit-ready engagement. If you operate inside the Raleigh / Triangle market, we can still talk, we can set scope and exclusion zones in writing.
What does an engagement look like and how long does it take?
The MSP Operations Pack runs in three phases. Discovery is a one-week sprint where we connect to your PSA, RMM, accounting, and (for MSSPs) SIEM, profile the data, and define the metric dictionary. Build is three to six weeks depending on portfolio breadth, six is typical for a full Operations plus MSSP build. Adoption is a four-week stabilization period with weekly working sessions and a written runbook. We work fixed fee against the agreed scope and quote on Request a Quote so the cost matches the actual integration surface and not a generic price list.
How do you protect our client data when you're building dashboards?
Access is least-privilege and time-bound. We connect read-only to your PSA, RMM, accounting, and security platforms through dedicated service accounts that you own. We document the access in writing and you revoke it at the end of the engagement. For regulated end-clients, CMMC, HIPAA, attorney work product, we can run the engagement inside the Petronella encrypted data and email system so client identifiers and sensitive metrics never sit in commercial mailboxes. Craig Petronella is a licensed Digital Forensic Examiner (DFE 604180), so chain-of-custody on data handling is something we take seriously.
Ready to put Power BI to work?
Tell us what you need. Blake or Craig replies within 4 business hours, often sooner.
About the author

Craig Petronella, CMMC-RP, Cisco CCNA, CWNE, Digital Forensic Examiner (License 604180-DFE), Amazon #1 Best-Selling Author of 14+ cybersecurity books. Founding principal of Petronella Technology Group, Inc. since 2002, an A+ BBB-accredited firm, CMMC RPO #1449 with the Cyber AB. Craig leads the firm's Power BI, AI, and CMMC practices, and has spent 23 years in the trenches with MSPs, MSSPs, and regulated mid-market clients across the United States. See the full bio and credential graph at our team.
Next steps
If you run an MSP, MSSP, or hybrid IT services firm and you want one operating picture, ticket SLA, technician utilization, MRR movement, churn risk, security posture, on the same screen, the next step is a 30-minute scoping call. We will look at your current stack, confirm whether the MSP Operations Pack fits, and quote against your real integration surface.
Or, if you run an MSP and want to resell Power BI work to your clients with a Petronella delivery team behind you, ask about the partner referral track in the same conversation.
Request a Quote → Partner referral track